Climate Insight

Protect your city from climate change

Cities are getting hotter, but most do not know where heat hits hardest. Climate Insight identifies urban heat islands and thermal stress risks, simulates mitigation actions and monitors their results.

Climate Insight platform: land surface temperature heat map of a neighbourhood with sensors and simulation phases

Data exists, but cannot be used effectively

Cities face growing pressure from rising temperatures and heat waves, driven by climate change and rapid urbanization. Planners and local governments find it hard to decide which interventions to prioritize, whether greening, reflective surfaces or urban redesign. They also lack a reliable way to measure the effect of those interventions and demonstrate their results.


Built for

Municipal governments and city authoritiesUrban planners and architectsPublic health authorities

What sets it apart

Heat as people actually feel it

Climate Insight calculates the Physiological Equivalent Temperature (PET) and maps Urban Heat Islands (UHI) at neighbourhood and street level, with green spaces, tree canopy, water bodies and surface materials analysed together. Cities can simulate the cooling impact of a plan before they take action.


What you gain

Cool the right places first

01

Data-driven urban planning

Integrate heat risk into zoning, development and renovation, and simulate new projects.

02

Targeted heat mitigation

Find high-risk zones and choose cooling solutions: tree canopy, reflective surfaces, water.

03

Building and renovation guidance

Understand the thermal impact of materials, layouts and renovations.

04

Optimized green space management

Invest in green infrastructure where the cooling benefit is greatest.

05

Climate resilience

Understand how heat islands evolve and build long-term adaptation plans.

06

Proof of results

Measure whether actions delivered the expected reduction in thermal stress.


Technical innovation

How it works

01

Thermal comfort estimation

The heat people actually feel, not only air or surface temperature.

02

Multi-source data fusion

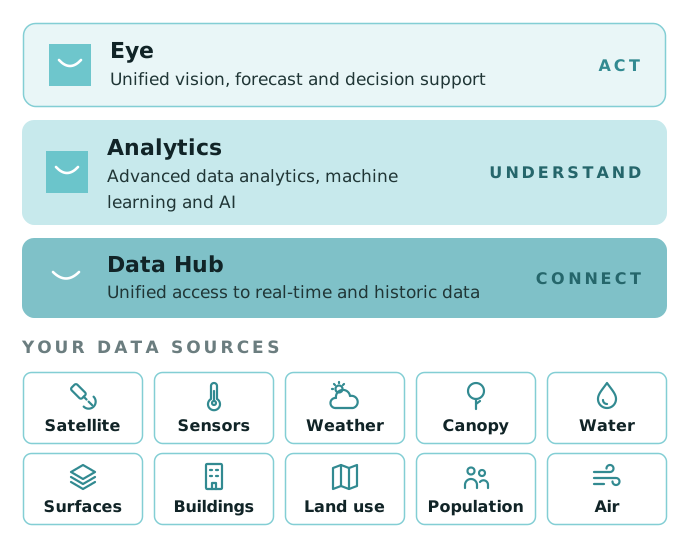
Satellite imagery, IoT sensors, GIS and municipal datasets in a single view.

03

Vulnerability maps

Identify at-risk populations and areas, to target action.

04

Cooling scenarios

Test cooling options before you build.

How Kentyou Climate Insight works: Data Hub connects, Analytics understands, Eye acts, on top of your climate data sources

Main features

What it offers today

Heat maps

From satellite imagery, IoT sensors and GIS data, at neighbourhood and street level.

Building and infrastructure profiling

How materials and layouts contribute to heat retention.

Land use and vegetation

Tree canopy, green space distribution and surface materials.

Historical analysis

Past and present trends to identify long-term heat island patterns.

Simulation and forecasting

Impact of infrastructure changes, green spaces and new materials.

Interactive maps and graphs

Explore patterns in space and time.


Explore our other solutions


Talk to our team

Questions about our products, services or partnerships? We are always looking to strengthen our impact in smart cities by joining forces.

Contact us