Data Insight

We reveal what no single system can see on its own

By combining multi-source data integration with AI-driven correlation analysis Kentyou Data Insight enables organizations to transform fragmented operational data into actionable intelligence.

Data Insight platform: dashboard with traffic KPIs, busiest intersections, average occupancy and latest events

Each system has a partial view

Organizations rely on many systems, sensors and databases, and each shows part of the picture. Teams lose time watching multiple systems and consolidating data by hand. The challenge is no longer accessing data: it is understanding how systems, processes and events interact.

Built for

MunicipalitiesRegionsTerritoriesAny organisation improving citizens’ lives

What you gain

From data to decisions

01

Connect all your systems in minutes

Data collection and analysis are automated, so data can be easily consolidated and manual monitoring reduced.

02

Focus on what matters

Rather than overwhelming users with raw data and disconnected dashboards we focus users on the situations, relationships and insights that count.

03

Take better decisions

By understanding the entire system you can optimize decisions using multiple criteria.

04

Take proactive action

Data Insight helps to identify the relationships between systems and anticipate how situations will evolve.

05

Stay open

We use open standards and a modular architecture to support integration, extensibility, and reduced dependency on proprietary systems.

06

Room to grow

Data Insight can scale with your needs. Add data sources, analyses and users as your requirements evolve.

Technical innovation

How it works

01

Proven open source core

Eclipse sensiNact, validated over 10+ years.

02

Plug and play

New devices join live, over tens of protocols.

03

Automatic objects and assets

Created automatically as data arrives.

04

Deploy where you need it

Cloud, on premise or at the edge, close to your devices.

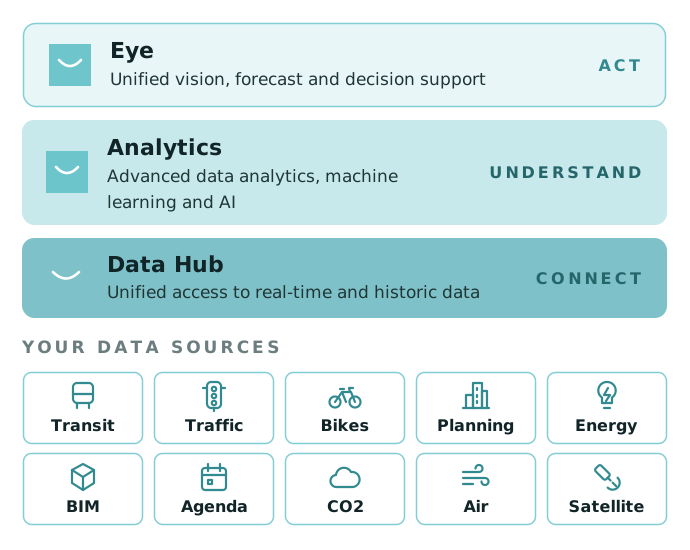
How Kentyou Data Insight works: Data Hub connects, Analytics understands, Eye acts, on top of your data sources

Main features

What it offers today

Cross-system analysis

Reveal how your systems, processes and events interact.

Live data

From sensors, data platforms, GIS, existing systems, third party data providers.

Interactive dashboards

Update live, with history and trend analysis.

Detection of unusual situations

Automatic detection, so teams react earlier.

Forecasts

Anticipate how situations will evolve.

Custom indicators

KPIs combining data from several domains.

Data Insight applied to your domain

Talk to our team

Questions about our products, services or partnerships? We are always looking to strengthen our impact in smart cities by joining forces.

Contact us